Measuring CRM return on investment in 2026 requires dividing net realized profit across sales gains, retention value, and labor savings by total system ownership costs, then multiplying by 100. While historical benchmarks promised returns of $8.71 per dollar, modern mature deployments yield an average baseline of $3.10 per dollar spent once accounting for a fully loaded cost model that adds a 1.4x to 1.6x multiplier over base software fees.
Measuring Net CRM Return Against Total Investment
Modern CRM return on investment averages approximately $3.10 returned per dollar invested. Nucleus Research established this contemporary baseline, reflecting a mature market compared to their historical 2014 benchmark of $8.71 per dollar as licensing and administrative costs increased.
Financial return follows a standard calculation: Net Profit from CRM divided by Total CRM Investment, multiplied by 100. Net profit aggregates gross margin from software-attributed deals, expansion value preserved through lower customer churn, and administrative hours saved through workflow automation.
Total CRM investment must incorporate a 1.4x to 1.6x cost multiplier against base vendor fees. This factor accounts for model token consumption, human oversight of automated workflows, and integration maintenance. Budgeting only for software seats understates total ownership costs and distorts reported returns.
A defensible measurement cadence relies on tracking four quarterly governance targets: selling time recovered per representative, forecast accuracy variance kept under 10%, a data quality index above 90%, and automated reconciliation for cross-system data consistency.
Reconciling CRM campaign reporting against general ledger finance actuals on a monthly basis prevents open pipeline from being misreported as realized ROI. Platform attribution tags only demonstrate potential value; finance ledger reconciliation ensures unearned pipeline is never recorded as realized profit.
Pipeline Velocity and Conversion Metrics That Isolate Impact
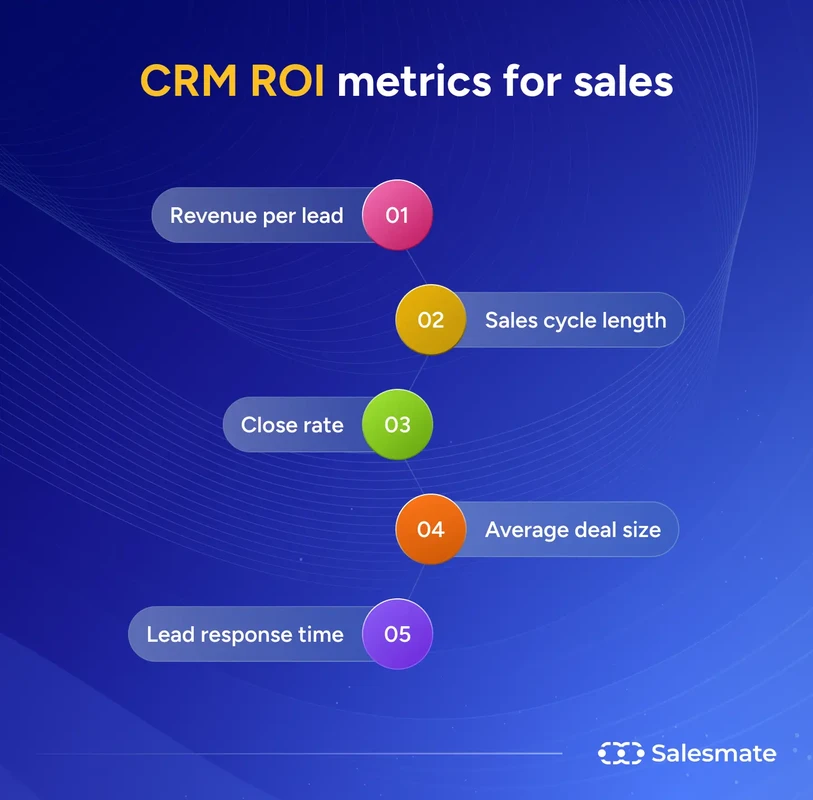
The pipeline metrics with the direct link to CRM workflows are lead-to-meeting conversion rate, pipeline generated per sales representative, and sales cycle length. These indicators evaluate platform execution independent of broader commercial market shifts.
Win rate serves as the primary lagging indicator of CRM performance, but it requires 90 to 180 days of post-deployment data to reach statistical significance. Measuring win rates during early rollout yields false negatives because enterprise opportunities require months to progress through technical validation and procurement.
Closed-loop timestamp tracking evaluates opportunity transition velocity between CRM-assisted deals and manual workflows across distinct pipeline stages. Tracking the exact duration between qualification, discovery, and contract review isolates whether automation speeds deal progression.
Underlying record hygiene directly drives commercial output. A 2026 CRM benchmark study by HubSpot and VEN Studio showed that organizations maintaining 95% or higher data quality achieve 36% higher revenue per sales representative and 27% shorter sales cycles.
Forecast accuracy gives a parallel growth signal. The Salesforce 2026 State of Sales report documented that companies maintaining 90% or higher forecast accuracy grow revenue 30% faster than organizations falling below 80% accuracy.
Attribution models also depend on structural tracking discipline. Findings from the Vendelux 2026 B2B Events Survey indicate that 90% of event teams see deals influenced by their programs receive zero CRM credit when tracking relies on manual inputs. Pre-tagging target accounts in the CRM across an extended 180-day attribution window prevents influenced multi-touch opportunities from losing attribution.
Valuing Retention Gains and Account Expansion
CRM revenue gains from existing accounts are isolated by tracking average deal size growth, upsell and cross-sell revenue, and contract renewal versus churn rates. Evaluating these metrics establishes how effectively account teams defend and expand existing contracts.
Optimized CRM account management workflows can deliver big commercial returns. In an enterprise case study published by Vtiger, Tech Magic Solutions achieved a 300% first-year CRM ROI, driven by a 30% increase in customer retention rates and a 35% reduction in sales cycles. Centralizing customer health milestones allows account owners to address churn risks before renewal dates.
Reductions in customer acquisition cost must be evaluated alongside customer lifetime value to confirm that acquisition efficiency is not masking the addition of high-churn accounts. Lower acquisition expenses give no financial benefit if customer lifetime value declines at an equivalent pace.
First-party customer interaction data captured across CRM touchpoints serves as the dependable foundation for calculating post-sale customer value. Tracking communication history, support cases, and product utilization within CRM records shows which relationship interventions drive expansion.
Attribution models must account for long-term nurture opportunities that take up to 12 months to close. Excluding delayed conversion cycles artificially deflates reported CRM return, misrepresenting programs that generate durable enterprise relationships.
Monetizing Administrative Time Reclaimed by Automation
Sales representatives spend 72% of their working hours on administrative duties rather than selling, according to Salesforce State of Sales data, leaving them far below the industry baseline of 40% active selling time.
Deploying CRM automation and AI agents reclaims a median of 6.4 administrative hours per worker weekly while cutting manual data entry error rates by 80% to 95%. Automating contact creation, interaction logging, and pipeline updates redirects hours directly toward buyer engagement.
Productivity return is monetized by multiplying reclaimed hours per representative per week by their fully loaded hourly compensation rate, then subtracting ongoing operational costs.
RevOps teams can evaluate this value through a concrete calculation: taking five sales representatives saving 5 hours weekly at a $45 loaded hourly rate produces $4,900 in monthly capacity, from which deducting operational maintenance establishes net return.
Eliminating manual task interruptions also mitigates the 23-minute cognitive refocusing penalty required after each workflow disruption, as documented in research shared by Nadav Wilf. Protecting continuous selling time converts recovered operational hours into qualified pipeline.